Introduction to the rpact Package
November 13, 2025
Overview 📦
- Comprehensive validated R package implementing methodology described in Wassmer and Brannath (2016), second edition published in Sep. 2025
- Enables the design of traditional and confirmatory adaptive group sequential designs
- Provides interim data analysis and simulation including early efficacy stopping and futility analyses
- Enables sample-size reassessment with different strategies
- Enables treatment arm selection in multi-stage multi-arm (MAMS) designs
- Enables subset selection in population enrichment designs
- Provides a comprehensive and reliable sample size calculator

Developed by RPACT 🏢
- RPACT company founded in 2017 by Gernot Wassmer and Friedrich Pahlke
- Idea: open source development with help of “crowd funding”
- Currently supported by 21 companies
- \(>\) 80 presentations and training courses since 2018, e.g., FDA in March 2022
- 29 vignettes based on Quarto and published on rpact.org/vignettes
- 28 releases on CRAN since 2018


![]()
RCONIS 🚀
- Grow RPACT company to offer a wider range of services
- Statistical consulting and engineering services: Research Consulting and Innovative Solutions
- Joint venture between RPACT GbR (rpact.com) and inferential.biostatistics GmbH (inferential.bio) founded by Daniel Sabanés Bové and Carrie Li
- Website: rconis.com

The R Package rpact – Functional Range

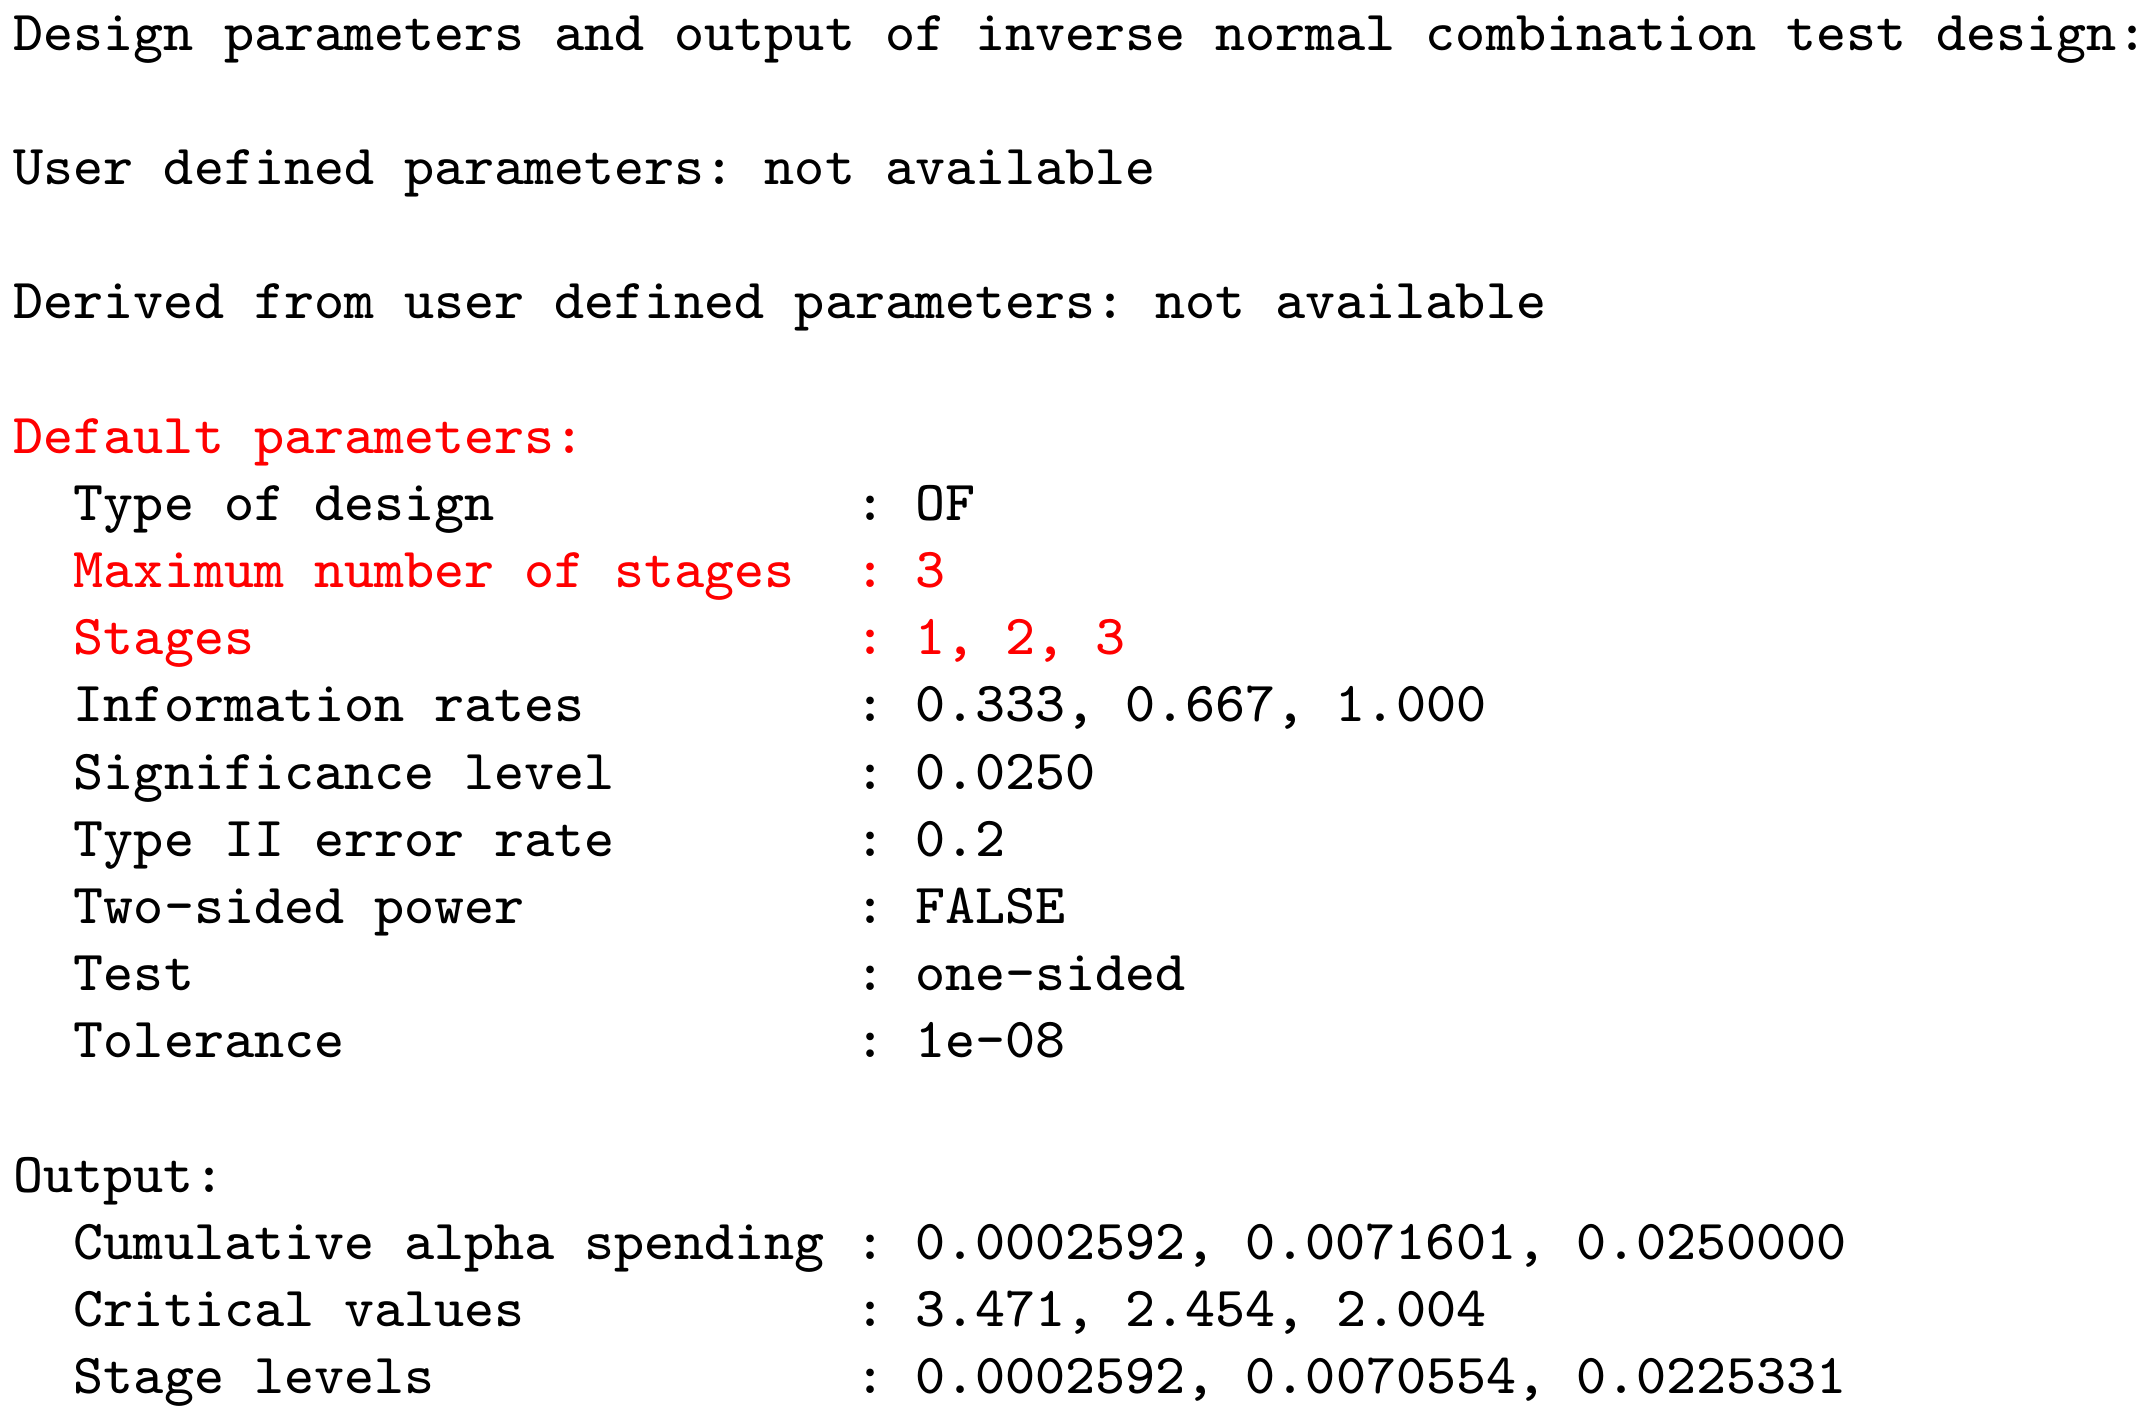
User Concept – Most parameters have a default value
Example: getDesignInverseNormal() produces the output:
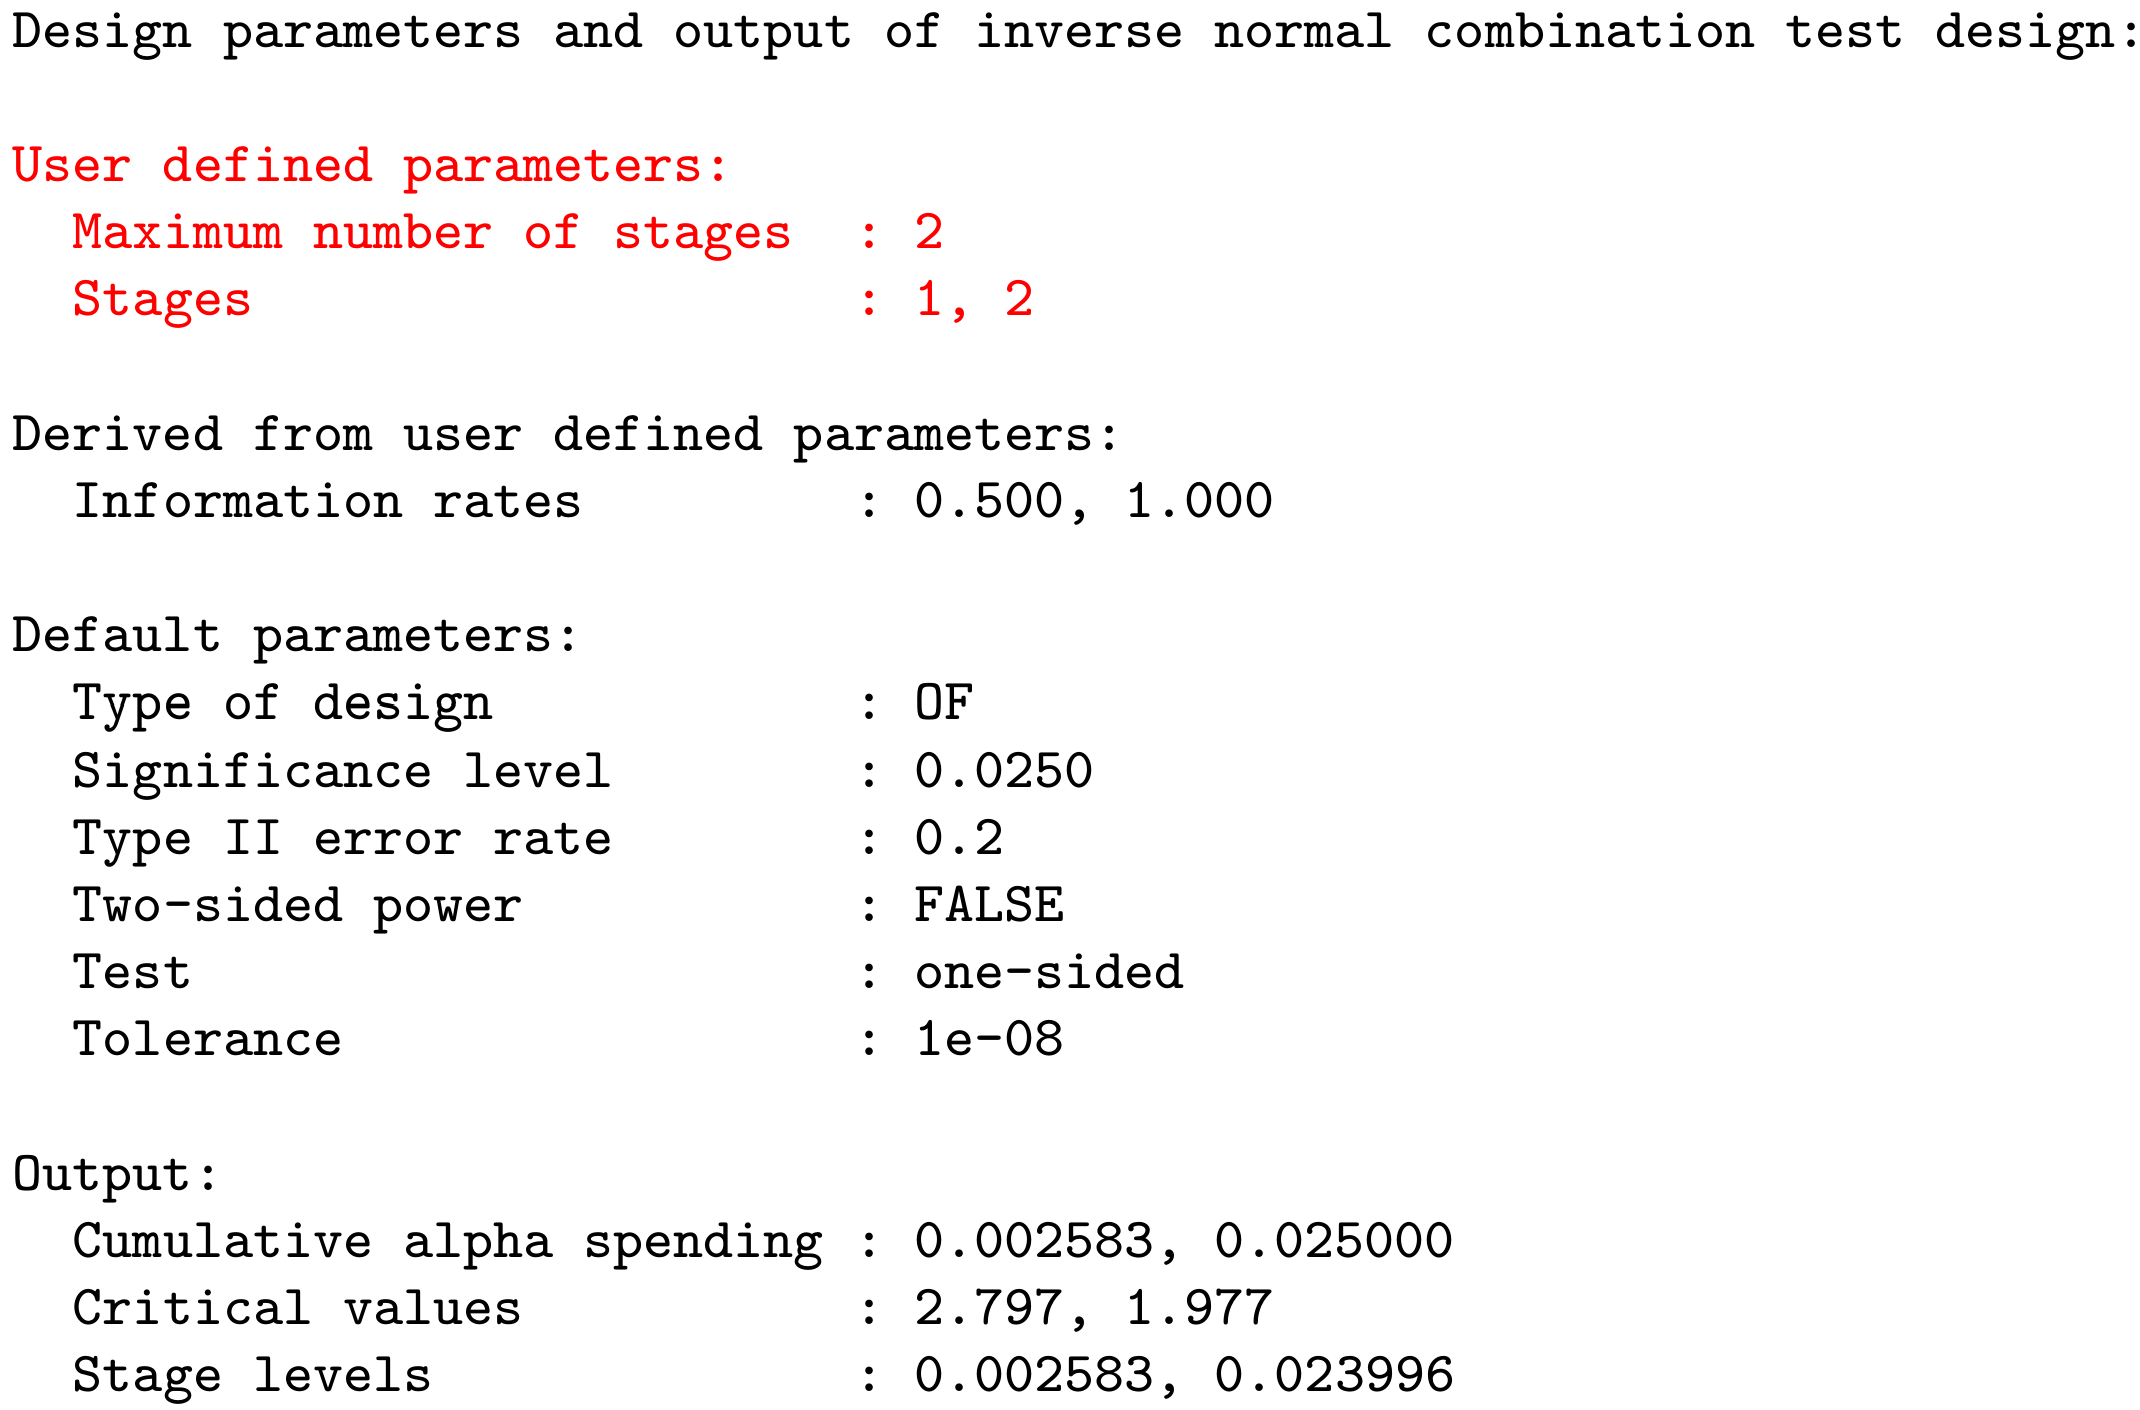
User Concept – Most parameters have a default value
Example: getDesignInverseNormal(kMax = 2) produces the output:
Second Edition of the Book

- Group Sequential and Confirmatory Adaptive Designs in Clinical Trials by Gernot Wassmer and Werner Brannath
- Second Edition (Springer, 2025) — published on September 24, 2025
- Now featuring numerous rpact R code examples demonstrating the methods implemented in the package
- For more information, visit: link.springer.com/book/10.1007/978-3-031-89669-9